cytonormpy.pl.cv_heatmap#
- cytonormpy.pl.cv_heatmap(cnp, n_metaclusters, max_cv=2.5, show_cv=1.5, cmap='viridis', figsize=(8, 4), ax=None, return_fig=False, show=True, save=None)#
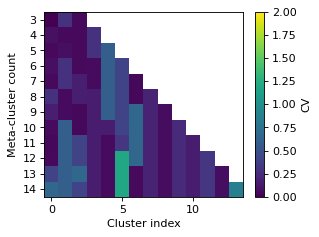
Plot a heatmap of cluster CVs for a set of meta‑cluster counts.
- Parameters:
cnp (
CytoNorm) – A CytoNorm instance that has run calculate_cluster_cvs.n_metaclusters (
list[int]) – List of meta‑cluster counts whose CVs you wish to plot.max_cv (
float) – Clip color scale at this CV value.show_cv (
float) – Only CVs >= show_cv get a numeric label.cmap (
str) – Name of the matplotlib colormap to use.figsize (
tuple[float,float]) – Figure size, used only if ax is None.ax (
Optional[Axes]) – Optional Axes to draw into. If None, a new Figure+Axes is created.return_fig (
bool) – If True, return the Figure; otherwise, return the Axes.show (
bool) – If True, call plt.show() at the end.save (
Optional[str]) – File path to save the figure. If None, no file is written.
- Returns:
If return_fig, returns the Figure; else returns the Axes. If both are False, returns None.
- Return type:
Figure or Axes or None
Examples
import cytonormpy as cnp

cn = cnp.example_cytonorm(use_clustering = True)
cn.calculate_cluster_cvs(n_metaclusters = list(range(3,15)))
cnp.pl.cv_heatmap(cn,
                  n_metaclusters = list(range(3,15)),
                  max_cv = 2,
                  figsize = (4,3)
                  )