cytonormpy.pl.mad#
- cytonormpy.pl.mad(cnp, colorby, data=None, file_name=None, channels=None, labels=None, mad_cutoff=0.25, grid=None, grid_n_cols=None, vary_textures=False, figsize=None, ax=None, return_fig=False, show=True, save=None, **kwargs)#
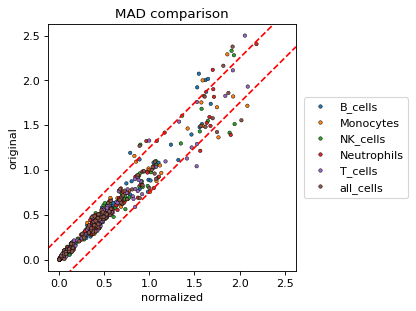
MAD plot visualization.
- Parameters:
colorby (
str) – Selects the coloring of the data points. Can be any of ‘file_name’, ‘label’, ‘channel’ or ‘change’. If ‘change’, the data points are colored whether the MAD metric increased or decreased.data (
Optional[DataFrame]) – Optional. If not plotted from a cytonorm object, data can be passed. Has to contain the index columns ‘file_name’, ‘label’ and ‘origin’ (containing ‘original’ and ‘normalized’).file_name (
Optional[Union`[:py:class:`list[str],str]]) – Optional. Can be used to select one or multiple files.channels (
Optional[Union`[:py:class:`list[str],str]]) – Optional. Can be used to select one or more channels.labels (
Optional[Union`[:py:class:`list[str],str]]) – Optional. Can be used to select one or more cell labels.mad_cutoff (
float) – A red dashed line that is plotted, signifying a cutoffgrid (
Optional[str]) – Whether to split the plots by the given variable. If left None, all data points are plotted into the same plot. Can be the same inputs as colorby.grid_n_cols (
Optional[int]) – The number of columns in the grid.vary_textures (
bool) – If True, will plot different markers for the ‘hue’ variable.ax (
Optional[ndarray[Sequence[Sequence[Axes]],dtype[object_]],Axes]]) – A Matplotlib Axes to plot into.return_fig (
bool) – Returns the figure. Defaults to False.show (
bool) – Whether to show the figure.save (
Optional[str]) – A string specifying a file path. Defaults to None, where no image is saved.kwargs – keyword arguments ultimately passed to sns.scatterplot.
- Return type:
If show==False, a
Axes.
Examples
import cytonormpy as cnp

cn = cnp.example_cytonorm()
cn = cnp.example_cytonorm()
cnp.pl.mad(cn,
           colorby = "label",
           s = 10,
           linewidth = 0.4,
           edgecolor = "black",
           figsize = (4,4))