cytonormpy.pl.scatter#
- cytonormpy.pl.scatter(cnp, file_name, x_channel, y_channel, x_scale='linear', y_scale='linear', xlim=None, ylim=None, legend_labels=None, subsample=None, linthresh=500, display_reference=True, vary_textures=False, figsize=(2, 2), ax=None, return_fig=False, show=True, save=None, **kwargs)#
Scatterplot visualization.
- Parameters:
file_name (
str) – The file name of the file that is supposed to be plotted.x_channel (
str) – The channel plotted on the x-axis.y_channel (
str) – The channel plotted on the y-axis.x_scale (
Literal['biex','log','linear']) – The scale type of the x-axis. Can be one of biex, linear or log. Defaults to biex.y_scale (
Literal['biex','log','linear']) – The scale type of the y-axis. Can be one of biex, linear or log. Defaults to biex.xlim (
Optional[tuple[float,float]]) – Sets the x-axis limits.ylim (
Optional[tuple[float,float]]) – Sets the y-axis limits.legend_labels (
Optional[list[str]]) – The labels displayed in the legend.subsample (
Optional[int]) – A number of events to subsample to. Can prevent overcrowding of the plot.linthresh (
float) – The value to switch from a linear to a log axis. Ignored if neither x- nor y-scale are biex.display_reference (
bool) – Whether to display the reference data from that batch as well. Defaults to True.vary_textures (
bool) – If True, use different marker shapes for each ‘origin’ category by passing style=”origin” and a markers mapping to seaborn.ax (
Optional[Axes]) – A Matplotlib Axes to plot into.return_fig (
bool) – Returns the figure. Defaults to False.show (
bool) – Whether to show the figure.save (
Optional[str]) – A string specifying a file path. Defaults to None, where no image is saved.kwargs – keyword arguments ultimately passed to sns.scatterplot.
- Return type:
If show==False, a
Axes.
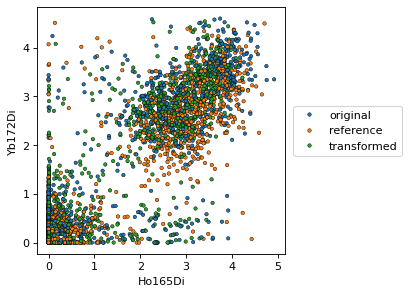
Examples
import cytonormpy as cnp

cn = cnp.example_cytonorm()
cnp.pl.scatter(cn,
               cn._datahandler.metadata.validation_file_names[0],
               x_channel = "Ho165Di",
               y_channel = "Yb172Di",
               x_scale = "linear",
               y_scale = "linear",
               figsize = (4,4),
               s = 10,
               linewidth = 0.4,
               edgecolor = "black")
Note
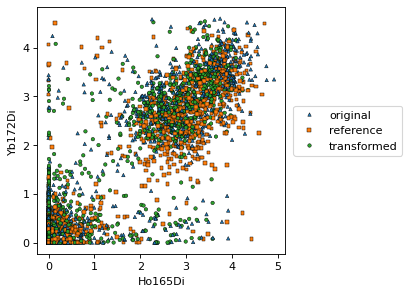
If you want additional separation of the individual point classes, you can pass ‘vary_textures=True’.
import cytonormpy as cnp

cn = cnp.example_cytonorm()
cnp.pl.scatter(cn,
               cn._datahandler.metadata.validation_file_names[0],
               x_channel = "Ho165Di",
               y_channel = "Yb172Di",
               x_scale = "linear",
               y_scale = "linear",
               vary_textures = True,
               figsize = (4,4),
               s = 10,
               linewidth = 0.4,
               edgecolor = "black")