cytonormpy.pl.histogram#
- cytonormpy.pl.histogram(cnp, file_name, x_channel=None, x_scale='linear', y_scale='linear', xlim=None, ylim=None, linthresh=500, subsample=None, display_reference=True, grid=None, grid_n_cols=None, channels=None, vary_textures=False, figsize=None, ax=None, return_fig=False, show=True, save=None, **kwargs)#
Histogram visualization.
- Parameters:
file_name (
str) – The file name of the file that is supposed to be plotted.x_channel (
Optional[str]) – The channel plotted on the x-axis.x_scale (
Literal['biex','log','linear']) – The scale type of the x-axis. Can be one of biex, linear or log. Defaults to biex.y_scale (
Literal['biex','log','linear']) – The scale type of the y-axis. Can be one of biex, linear or log. Defaults to biex.legend_labels – The labels displayed in the legend.
linthresh (
float) – The value to switch from a linear to a log axis. Ignored if neither x- nor y-scale are biex.subsample (
Optional[int]) – A number of events to subsample to. Can prevent overcrowding of the plot.display_reference (
bool) – Whether to display the reference data from that batch as well. Defaults to True.grid (
Optional[Literal['channels']]) – Can be’channels’. Will plot a grid where each channel gets its own plot. A file_name has to be provided.channels (
Optional[Union`[:py:class:`list[str],str]]) – Optional. Can be used to select one or more channels that will be plotted in the grid.vary_textures (
bool) – If True, apply different line styles per origin category.ax (
Optional[ndarray[Sequence[Sequence[Axes]],dtype[object_]],Axes]]) – A Matplotlib Axes to plot into.return_fig (
bool) – Returns the figure. Defaults to False.show (
bool) – Whether to show the figure.save (
Optional[str]) – A string specifying a file path. Defaults to None, where no image is saved.kwargs – keyword arguments ultimately passed to sns.scatterplot.
- Return type:
If show==False, a
Axes.
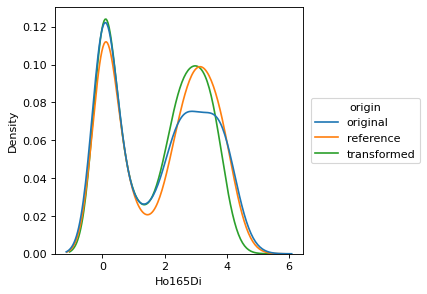
Examples
import cytonormpy as cnp

cn = cnp.example_cytonorm()
cnp.pl.histogram(cn,
                 cn._datahandler.metadata.validation_file_names[0],
                 x_channel = "Ho165Di",
                 x_scale = "linear",
                 y_scale = "linear",
                 figsize = (4,4))
Note
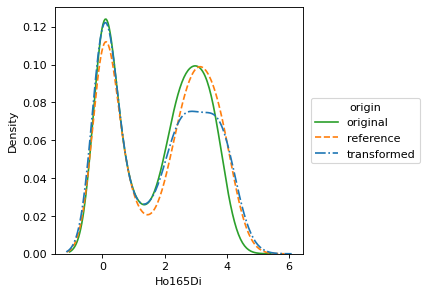
If you want additional separation of the individual point classes, you can pass ‘vary_textures=True’.
import cytonormpy as cnp

cn = cnp.example_cytonorm()
cnp.pl.histogram(cn,
                 cn._datahandler.metadata.validation_file_names[0],
                 x_channel = "Ho165Di",
                 x_scale = "linear",
                 y_scale = "linear",
                 figsize = (4,4),
                 vary_textures = True)