cytonormpy.pl.splineplot#
- cytonormpy.pl.splineplot(cnp, file_name, channel, label_quantiles=[0.1, 0.25, 0.5, 0.75, 0.9], x_scale='linear', y_scale='linear', xlim=None, ylim=None, linthresh=500, figsize=(2, 2), ax=None, return_fig=False, show=True, save=None, **kwargs)#
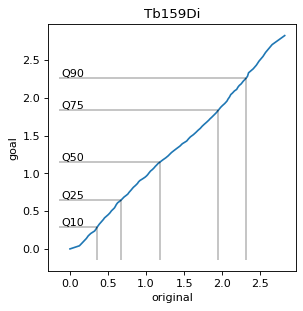
Splineplot visualization.
- Parameters:
file_name (
str) – The file name of the file that is supposed to be plotted.channel (
str) – The channel to be plotted.label_quantiles (
Optional[list[float]]) – A list of the quantiles that are labeled in the plot.x_scale (
Literal['biex','log','linear']) – The scale type of the x-axis. Can be one of biex, linear or log. Defaults to biex.y_scale (
Literal['biex','log','linear']) – The scale type of the y-axis. Can be one of biex, linear or log. Defaults to biex.xlim (
Optional[tuple[float,float]]) – Sets the x-axis limits.ylim (
Optional[tuple[float,float]]) – Sets the y-axis limits.linthresh (
float) – The value to switch from a linear to a log axis. Ignored if neither x- nor y-scale are biex.ax (
Optional[Axes]) – A Matplotlib Axes to plot into.return_fig (
bool) – Returns the figure. Defaults to False.show (
bool) – Whether to show the figure.save (
Optional[str]) – A string specifying a file path. Defaults to None, where no image is saved.kwargs – keyword arguments ultimately passed to sns.lineplot.
- Return type:
If show==False, a
Axes.
Examples
import cytonormpy as cnp

cn = cnp.example_cytonorm()
cnp.pl.splineplot(cn,
                  cn._datahandler.metadata.validation_file_names[0],
                  channel = "Tb159Di",
                  x_scale = "linear",
                  y_scale = "linear",
                  figsize = (4,4))